Revision history [back]
| 1 |
initial version
|
|
The best source of information that I can recommend for planning the physical aspects of the tests is BS ISO 14686, available for Download at https://shop.bsigroup.com/. For analysis of the data the best resource available is Analysis and Evaluation of Pump test data, available at https://www.hydrology.nl/images/docs/dutch/key/Kruseman_and_De_Ridder_2000.pdf.
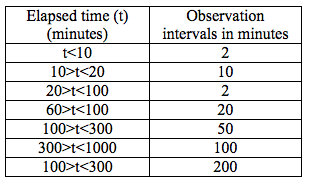
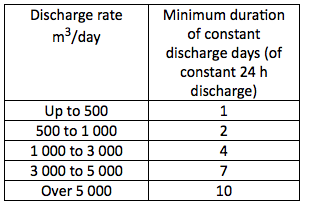
A step draw down test will provide the design data that you are looking for. In order to determine the performance of the well under production conditions a Constant rate drawdown test will be required. This would normally be followed by monitoring the recovery levels in the well. Observation of water levels can be carried out using a manual dipper, preferably with an optical indicator. The frequencies in the table below are suitable for both tests. All of the tests can be carried out as single well tests (no observation piezometers required). For recovery tests a non return valve is absolutely necessary. Table 5 6: Observation frequency by pump test phase. Source BS ISO 14686: 2003 Hydrometeric Determinations. Pumping tests for water wells. Considerations and guidelines for design, performance and use, Table 1, p.g. 11 Elapsed time (t) (minutes) Observation intervals in minutes t<10 2 10>t<20 10 20>t<100 2 60>t<100 20 100>t<300 50 300>t<1000 100 100>t<300 200 Minimum duration of Constant Discharge tests. Source BS ISO 14686: 2003 Hydrometeric Determinations. Pumping tests for water wells. Considerations and guidelines for design, performance and use, Table 1, p.g. 11 Discharge rate m3/day Minimum duration of constant discharge days (of constant 24 h discharge) Up to 500 1 500 to 1 000 2 1 000 to 3 000 4 3 000 to 5 000 7 Over 5 000 10
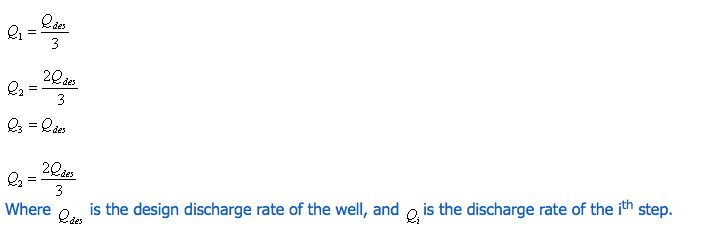
Recommended discharge rate increments for Step Drawdown tests:
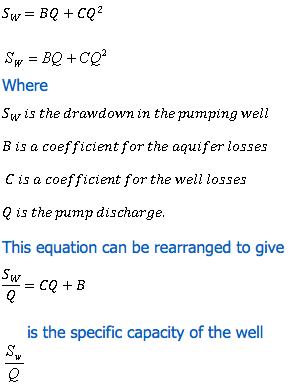
Where is the design discharge rate of the well, and is the discharge rate of the ith step. These rates are guidelines only. In designing the flow rates must be chosen to ensure that the drawdown does not cause the water level to drop below the level of the pump intake. Steps of 2 hours are normally sufficient. The time drawdown data from the step test can be used directly in the analysis of the pump test data if steady state has been achieved by the end of the pumping step. If steady state conditions have not been achieved the time drawdown data should be corrected according to the method of Hantush-Biershenk before the analysis can be completed. See (Kruseman & de Ridder, 1994) for detailed description of this procedure. The step drawdown test is based on the Jacobs equation, see below Equation 5 3: Jacob Equation
Where
This equation can be rearranged to give
is the specific capacity of the well
A plot of the specific capacity against pump discharge will be linear. The slope of the line will be equal to C. The intercept of the line with the with the Q axis will be equal to the value of the B, the well loss coefficient. Once calculated these coefficients are used to determine the drawdown levels in the well and the design pumping rate.
Ideally the test should be supervised by a qualified hydro geologist. If this is not possible then, in theory, if a standard format for data collection (see below) is used this could be analysed remotely, and the quality of the data post test could be quality checked by a hydro geologist. Please not that there is no such thing as a standard aquifer and consequently no such thing as a standard well or pump test. The above is as generic as possible. If you cannot have the tests supervised by suitably qualified and experienced staff then there is a high risk that the data derived from the tests may not be reliable. This could be quite an expensive gamble. It might be advisable to review your project objectives to see if there are alternatives avaialable?
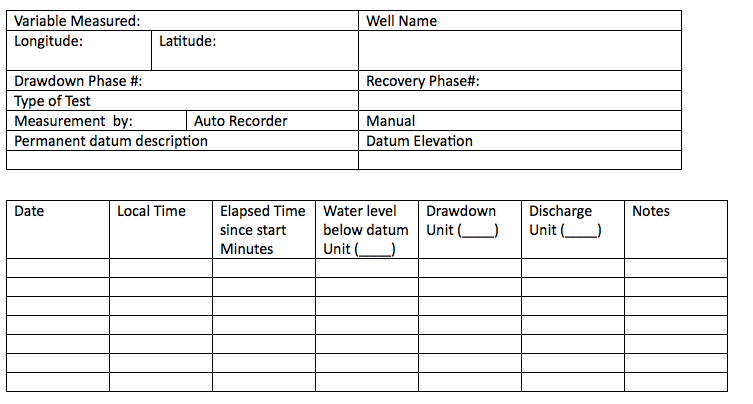
From the data supplied you will need to use a submersible pump. The actual pump used will be determined by the diameter of the existing bore hole pump casing. Best advice I i can give is to supply the data below to potential suppliers (Grundfos pumps are a popular and reliable choice). Their technical support will be able to make recommendations on pump type numbers, power cables and will recommend generators and electrical control equipment. Once you have this information it should be relatively straight forward to determine the type of lifting equipment that you will need. The ISO standard contains comprehensive information on flow measurement. Refer to Kruszemann and Derider for a detailed description of the types of diagnostic plots required during the pump tests. Example of data collection Format for pump test.
Variable Measured: Well Name Longitude: Latitude:
Drawdown Phase #: Recovery Phase#: Type of
Test
Measurement by: Auto Recorder Manual Permanent datum description Datum Elevation
Date Local Time Elapsed Time since start Minutes Water level below datum Unit (____) Drawdown Unit (____) Discharge Unit (____) Notes
Hope this helps. Unfortunately this is a broad area, and the above is the best that I can do at the moment
Best regards
John C
| 2 |
No.2 Revision
|
|

The best source of information that I can recommend for planning the physical aspects of the tests is BS ISO 14686, available for Download at https://shop.bsigroup.com/. For analysis of the data the best resource available is Analysis and Evaluation of Pump test data, available at https://www.hydrology.nl/images/docs/dutch/key/Kruseman_and_De_Ridder_2000.pdf.
A step draw down test will provide the design data that you are looking for. In order to determine
the performance of the well under production conditions a Constant rate drawdown test will be
required. This would normally be followed by monitoring the recovery levels in the well. Observation
of water levels can be carried out using a manual dipper, preferably with an optical indicator. The
frequencies in the table below are suitable for both tests. All of the tests can be carried out as
single well tests (no observation piezometers required). For recovery tests a non return valve is
absolutely necessary. Table 5 6: Observation frequency by pump test phase. Source BS ISO 14686: 2003
Hydrometeric Determinations. Pumping tests for water wells. Considerations and guidelines for
design, performance and use, Table 1, p.g.
11 Elapsed time (t) (minutes) Observation intervals in minutes t<10 2 10>t<20 10 20>t<100
2 60>t<100 20 100>t<300 50 300>t<1000 100 100>t<300 200
11
Minimum duration of Constant Discharge tests. Source BS ISO 14686: 2003 Hydrometeric Determinations. Pumping tests for water wells. Considerations and guidelines for design, performance and use, Table 1, p.g. 11 Discharge rate m3/day Minimum duration of constant discharge days (of constant 24 h discharge) Up to 500 1 500 to 1 000 2 1 000 to 3 000 4 3 000 to 5 000 7 Over 5 000 10
Recommended discharge rate increments for Step Drawdown tests:
Where is the design discharge rate of the well, and is the discharge rate of the ith step. These rates are guidelines only. In designing the flow rates must be chosen to ensure that the drawdown does not cause the water level to drop below the level of the pump intake. Steps of 2 hours are normally sufficient. The time drawdown data from the step test can be used directly in the analysis of the pump test data if steady state has been achieved by the end of the pumping step. If steady state conditions have not been achieved the time drawdown data should be corrected according to the method of Hantush-Biershenk before the analysis can be completed. See (Kruseman & de Ridder, 1994) for detailed description of this procedure. The step drawdown test is based on the Jacobs equation, see below Equation 5 3: Jacob Equation
Where
This equation can be rearranged to give
is the specific capacity of the well
A plot of the specific capacity against pump discharge will be linear. The slope of the line will be equal to C. The intercept of the line with the with the Q axis will be equal to the value of the B, the well loss coefficient. Once calculated these coefficients are used to determine the drawdown levels in the well and the design pumping rate.
Ideally the test should be supervised by a qualified hydro geologist. If this is not possible then, in theory, if a standard format for data collection (see below) is used this could be analysed remotely, and the quality of the data post test could be quality checked by a hydro geologist. Please not that there is no such thing as a standard aquifer and consequently no such thing as a standard well or pump test. The above is as generic as possible. If you cannot have the tests supervised by suitably qualified and experienced staff then there is a high risk that the data derived from the tests may not be reliable. This could be quite an expensive gamble. It might be advisable to review your project objectives to see if there are alternatives avaialable?
From the data supplied you will need to use a submersible pump. The actual pump used will be determined by the diameter of the existing bore hole pump casing. Best advice I i can give is to supply the data below to potential suppliers (Grundfos pumps are a popular and reliable choice). Their technical support will be able to make recommendations on pump type numbers, power cables and will recommend generators and electrical control equipment. Once you have this information it should be relatively straight forward to determine the type of lifting equipment that you will need. The ISO standard contains comprehensive information on flow measurement. Refer to Kruszemann and Derider for a detailed description of the types of diagnostic plots required during the pump tests. Example of data collection Format for pump test.
Variable Measured: Well Name Longitude: Latitude:
Drawdown Phase #: Recovery Phase#: Type of
Test
Measurement by: Auto Recorder Manual Permanent datum description Datum Elevation
Date Local Time Elapsed Time since start Minutes Water level below datum Unit (____) Drawdown Unit (____) Discharge Unit (____) Notes
Hope this helps. Unfortunately this is a broad area, and the above is the best that I can do at the moment
Best regards
John C
| 3 |
No.3 Revision
|
|
The best source of information that I can recommend for planning the physical aspects of the tests is BS ISO 14686, available for Download at https://shop.bsigroup.com/. For analysis of the data the best resource available is Analysis and Evaluation of Pump test data, available at https://www.hydrology.nl/images/docs/dutch/key/Kruseman_and_De_Ridder_2000.pdf.
A step draw down test will provide the design data that you are looking for. In order to determine the performance of the well under production conditions a Constant rate drawdown test will be required. This would normally be followed by monitoring the recovery levels in the well. Observation of water levels can be carried out using a manual dipper, preferably with an optical indicator. The frequencies in the table below are suitable for both tests. All of the tests can be carried out as single well tests (no observation piezometers required). For recovery tests a non return valve is absolutely necessary. Table 5 6: Observation frequency by pump test phase. Source BS ISO 14686: 2003 Hydrometeric Determinations. Pumping tests for water wells. Considerations and guidelines for design, performance and use, Table 1, p.g. 11
Minimum duration of Constant Discharge tests. Source BS ISO 14686: 2003 Hydrometeric
Determinations. Pumping tests for water wells. Considerations and guidelines for design, performance
and use, Table 1, p.g.
11 Discharge rate m3/day Minimum duration of constant discharge days (of constant 24 h
discharge) Up to 500 1 500 to 1 000 2 1 000 to 3 000 4 3 000 to 5 000 7 Over 5 000 10
11
Recommended discharge rate increments for Step Drawdown tests:
Where is the design discharge rate of the well, and is the discharge rate of the ith step.
These rates are guidelines only. In designing the flow rates must be chosen to ensure that the drawdown does not cause the water level to drop below the level of the pump intake. Steps of 2 hours are normally sufficient. The time drawdown data from the step test can be used directly in the analysis of the pump test data if steady state has been achieved by the end of the pumping step. If steady state conditions have not been achieved the time drawdown data should be corrected according to the method of Hantush-Biershenk before the analysis can be completed. See (Kruseman & de Ridder, 1994) for detailed description of this procedure. The step drawdown test is based on the Jacobs equation, see below Equation 5 3: Jacob Equation
Where
This equation can be rearranged to give
is the specific capacity of the well
A plot of the specific capacity against pump discharge will be linear. The slope of the line will be equal to C. The intercept of the line with the with the Q axis will be equal to the value of the B, the well loss coefficient. Once calculated these coefficients are used to determine the drawdown levels in the well and the design pumping rate.
Ideally the test should be supervised by a qualified hydro geologist. If this is not possible then, in theory, if a standard format for data collection (see below) is used this could be analysed remotely, and the quality of the data post test could be quality checked by a hydro geologist. Please not that there is no such thing as a standard aquifer and consequently no such thing as a standard well or pump test. The above is as generic as possible. If you cannot have the tests supervised by suitably qualified and experienced staff then there is a high risk that the data derived from the tests may not be reliable. This could be quite an expensive gamble. It might be advisable to review your project objectives to see if there are alternatives avaialable?
From the data supplied you will need to use a submersible pump. The actual pump used will be determined by the diameter of the existing bore hole pump casing. Best advice I i can give is to supply the data below to potential suppliers (Grundfos pumps are a popular and reliable choice). Their technical support will be able to make recommendations on pump type numbers, power cables and will recommend generators and electrical control equipment. Once you have this information it should be relatively straight forward to determine the type of lifting equipment that you will need. The ISO standard contains comprehensive information on flow measurement. Refer to Kruszemann and Derider for a detailed description of the types of diagnostic plots required during the pump tests. Example of data collection Format for pump test.
Variable Measured: Well Name Longitude: Latitude:
Drawdown Phase #: Recovery Phase#: Type of
Test
Measurement by: Auto Recorder Manual Permanent datum description Datum Elevation
Date Local Time Elapsed Time since start Minutes Water level below datum Unit (____) Drawdown Unit
(____) Discharge Unit (____) Notes
Hope this helps. Unfortunately this is a broad area, and the above is the best that I can do at the moment
Best regards
John C
| 4 |
No.4 Revision
|
|
The best source of information that I can recommend for planning the physical aspects of the tests is BS ISO 14686, available for Download at https://shop.bsigroup.com/. For analysis of the data the best resource available is Analysis and Evaluation of Pump test data, available at https://www.hydrology.nl/images/docs/dutch/key/Kruseman_and_De_Ridder_2000.pdf.
A step draw down test will provide the design data that you are looking for. In order to determine the performance of the well under production conditions a Constant rate drawdown test will be required. This would normally be followed by monitoring the recovery levels in the well. Observation of water levels can be carried out using a manual dipper, preferably with an optical indicator. The frequencies in the table below are suitable for both tests. All of the tests can be carried out as single well tests (no observation piezometers required). For recovery tests a non return valve is absolutely necessary. Table 5 6: Observation frequency by pump test phase. Source BS ISO 14686: 2003 Hydrometeric Determinations. Pumping tests for water wells. Considerations and guidelines for design, performance and use, Table 1, p.g. 11
Minimum duration of Constant Discharge tests. Source BS ISO 14686: 2003 Hydrometeric Determinations. Pumping tests for water wells. Considerations and guidelines for design, performance and use, Table 1, p.g. 11
Recommended discharge rate increments for Step Drawdown tests:
These rates are guidelines only. In designing the flow rates must be chosen to ensure that the
drawdown does not cause the water level to drop below the level of the pump intake. Steps of 2 hours
are normally sufficient. The time drawdown data from the step test can be used directly in the
analysis of the pump test data if steady state has been achieved by the end of the pumping step. If
steady state conditions have not been achieved the time drawdown data should be corrected according
to the method of Hantush-Biershenk before the analysis can be completed. See (Kruseman & de
Ridder, 1994) for detailed description of this procedure. The step drawdown test is based on the
Jacobs equation, see
below
below
Equation 5 3: Jacob Equation
A plot of the specific capacity against pump discharge will be linear. The slope of the line will be equal to C. The intercept of the line with the with the Q axis will be equal to the value of the B, the well loss coefficient. Once calculated these coefficients are used to determine the drawdown levels in the well and the design pumping rate.
Ideally the test should be supervised by a qualified hydro geologist. If this is not possible then, in theory, if a standard format for data collection (see below) is used this could be analysed remotely, and the quality of the data post test could be quality checked by a hydro geologist. Please not that there is no such thing as a standard aquifer and consequently no such thing as a standard well or pump test. The above is as generic as possible. If you cannot have the tests supervised by suitably qualified and experienced staff then there is a high risk that the data derived from the tests may not be reliable. This could be quite an expensive gamble. It might be advisable to review your project objectives to see if there are alternatives avaialable?
From the data supplied you will need to use a submersible pump. The actual pump used will be
determined by the diameter of the existing bore hole pump casing. Best advice I i can give is to
supply the data below to potential suppliers (Grundfos pumps are a popular and reliable choice).
Their technical support will be able to make recommendations on pump type numbers, power cables and
will recommend generators and electrical control equipment. Once you have this information it should
be relatively straight forward to determine the type of lifting equipment that you will need. The
ISO standard contains comprehensive information on flow measurement. Refer to Kruszemann and Derider
for a detailed description of the types of diagnostic plots required during the pump
tests.
tests.
Example of data collection Format for pump test.
Hope this helps. Unfortunately this is a broad area, and the above is the best that I can do at the moment
Best regards
John C
| 5 |
No.5 Revision
|
|
The best source of information that I can recommend for planning the physical aspects of the tests is BS ISO 14686, available for Download at https://shop.bsigroup.com/. For analysis of the data the best resource available is Analysis and Evaluation of Pump test data, available at https://www.hydrology.nl/images/docs/dutch/key/Kruseman_and_De_Ridder_2000.pdf.
A step draw down test will provide the design data that you are looking for. In order to determine
the performance of the well under production conditions a Constant rate drawdown test will be
required. This would normally be followed by monitoring the recovery levels in the well. Observation
of water levels can be carried out using a manual dipper, preferably with an optical indicator. The
frequencies in the table below are suitable for both tests. All of the tests can be carried out as
single well tests (no observation piezometers required). For recovery tests a non return valve is
absolutely
necessary.
necessary.
Table 5 6: Observation frequency by pump test phase. Source BS ISO 14686: 2003 Hydrometeric Determinations. Pumping tests for water wells. Considerations and guidelines for design, performance and use, Table 1, p.g. 11
Minimum duration of Constant Discharge tests. Source BS ISO 14686: 2003 Hydrometeric Determinations. Pumping tests for water wells. Considerations and guidelines for design, performance and use, Table 1, p.g. 11
Recommended discharge rate increments for Step Drawdown tests:
These rates are guidelines only. In designing the flow rates must be chosen to ensure that the drawdown does not cause the water level to drop below the level of the pump intake. Steps of 2 hours are normally sufficient. The time drawdown data from the step test can be used directly in the analysis of the pump test data if steady state has been achieved by the end of the pumping step. If steady state conditions have not been achieved the time drawdown data should be corrected according to the method of Hantush-Biershenk before the analysis can be completed. See (Kruseman & de Ridder, 1994) for detailed description of this procedure. The step drawdown test is based on the Jacobs equation, see below
Equation 5 3: Jacob Equation
A plot of the specific capacity against pump discharge will be linear. The slope of the line will be equal to C. The intercept of the line with the with the Q axis will be equal to the value of the B, the well loss coefficient. Once calculated these coefficients are used to determine the drawdown levels in the well and the design pumping rate.
Ideally the test should be supervised by a qualified hydro geologist. If this is not possible then, in theory, if a standard format for data collection (see below) is used this could be analysed remotely, and the quality of the data post test could be quality checked by a hydro geologist. Please not that there is no such thing as a standard aquifer and consequently no such thing as a standard well or pump test. The above is as generic as possible. If you cannot have the tests supervised by suitably qualified and experienced staff then there is a high risk that the data derived from the tests may not be reliable. This could be quite an expensive gamble. It might be advisable to review your project objectives to see if there are alternatives avaialable?
From the data supplied you will need to use a submersible pump. The actual pump used will be determined by the diameter of the existing bore hole pump casing. Best advice I i can give is to supply the data below to potential suppliers (Grundfos pumps are a popular and reliable choice). Their technical support will be able to make recommendations on pump type numbers, power cables and will recommend generators and electrical control equipment. Once you have this information it should be relatively straight forward to determine the type of lifting equipment that you will need. The ISO standard contains comprehensive information on flow measurement. Refer to Kruszemann and Derider for a detailed description of the types of diagnostic plots required during the pump tests.
Example of data collection Format for pump test.
Hope this helps. Unfortunately this is a broad area, and the above is the best that I can do at the moment
Best regards
John C
| 6 |
No.6 Revision
|
|
The best source of information that I can recommend for planning the physical aspects of the tests is BS ISO 14686, available for Download at https://shop.bsigroup.com/. For analysis of the data the best resource available is Analysis and Evaluation of Pump test data, available at https://www.hydrology.nl/images/docs/dutch/key/Kruseman_and_De_Ridder_2000.pdf.
A step draw down test will provide the design data that you are looking for. In order to determine the performance of the well under production conditions a Constant rate drawdown test will be required. This would normally be followed by monitoring the recovery levels in the well. Observation of water levels can be carried out using a manual dipper, preferably with an optical indicator. The frequencies in the table below are suitable for both tests. All of the tests can be carried out as single well tests (no observation piezometers required). For recovery tests a non return valve is absolutely necessary.
Table
5 6:
5-6:
Observation frequency by pump test phase. Source BS ISO 14686: 2003 Hydrometeric Determinations.
Pumping tests for water wells. Considerations and guidelines for design, performance and use, Table
1, p.g. 11
Minimum duration of Constant Discharge tests. Source BS ISO 14686: 2003 Hydrometeric Determinations. Pumping tests for water wells. Considerations and guidelines for design, performance and use, Table 1, p.g. 11
Recommended discharge rate increments for Step Drawdown tests:
These rates are guidelines only. In designing the flow rates must be chosen to ensure that the drawdown does not cause the water level to drop below the level of the pump intake. Steps of 2 hours are normally sufficient. The time drawdown data from the step test can be used directly in the analysis of the pump test data if steady state has been achieved by the end of the pumping step. If steady state conditions have not been achieved the time drawdown data should be corrected according to the method of Hantush-Biershenk before the analysis can be completed. See (Kruseman & de Ridder, 1994) for detailed description of this procedure. The step drawdown test is based on the Jacobs equation, see below
Equation 5 3: Jacob Equation
A plot of the specific capacity against pump discharge will be linear. The slope of the line will be equal to C. The intercept of the line with the with the Q axis will be equal to the value of the B, the well loss coefficient. Once calculated these coefficients are used to determine the drawdown levels in the well and the design pumping rate.
Ideally the test should be supervised by a qualified hydro geologist. If this is not possible then, in theory, if a standard format for data collection (see below) is used this could be analysed remotely, and the quality of the data post test could be quality checked by a hydro geologist. Please not that there is no such thing as a standard aquifer and consequently no such thing as a standard well or pump test. The above is as generic as possible. If you cannot have the tests supervised by suitably qualified and experienced staff then there is a high risk that the data derived from the tests may not be reliable. This could be quite an expensive gamble. It might be advisable to review your project objectives to see if there are alternatives avaialable?
From the data supplied you will need to use a submersible pump. The actual pump used will be determined by the diameter of the existing bore hole pump casing. Best advice I i can give is to supply the data below to potential suppliers (Grundfos pumps are a popular and reliable choice). Their technical support will be able to make recommendations on pump type numbers, power cables and will recommend generators and electrical control equipment. Once you have this information it should be relatively straight forward to determine the type of lifting equipment that you will need. The ISO standard contains comprehensive information on flow measurement. Refer to Kruszemann and Derider for a detailed description of the types of diagnostic plots required during the pump tests.
Example of data collection Format for pump test.
Hope this helps. Unfortunately this is a broad area, and the above is the best that I can do at the moment
Best regards
John C